navstats
navstats makes it possible to retrieve any data from the database and send it to Graphite so that it can be used in graphs and reports in NAV and other tools with access to the Graphite web-api.
Introduction
navstats was originally to be called Management statistics and was meant to cover the need for having relevant statistics regarding your network to show to your boss or management. However, finding a common ground for what the management wanted to see turned out to be impossible, and the fleeting and not very well formulated demands meant that nothing concrete was going to be made ever.
This lead to a fundamental shift in the proposal. What was implemented was a way to enable NAV administrators to write SQL-statements that produced the statistics they wanted and periodically send it to Carbon. Thus the NAV administrator himself decides what data is important, and the Graphite web-api enables him to extract data as he wishes - either as a graph directly in NAV or to other external tools.
The original request and final proposal is available on Launchpad and GitHub.
Usage
There are three steps for starting out with navstats:
navstats requires that you either know the structure of the NAV database very well or is able to formulate your requirement to someone that does, for instance using one of the support-channels. The reason for this is that you need an SQL statement that produces the number(s) you are looking for.
You need to know what a metric path is in Graphite, and how it is relevant for storing data. Basically, you need to choose the naming scheme for your data. All NAV-data starts with nav., so your data should probably have another prefix.
Read the navstats.conf-file and fill in what you gathered in step 1 and 2. Make sure the navstats-process is not running before editing the config-file by running the command
nav stop navstats
Example
We use the example from the config-file that continuously counts the different types of equipment in the database.
SQL
SELECT vendorid, typename, count(*)
FROM netbox JOIN type USING(typeid)
GROUP BY typename, vendorid;
The query will produce lines like this:
vendorid |        typename         | count
----------+-------------------------+-------
brocade  | 4/24_san_switch         |     1
hp       | hp2610_24               |     2
hp       | hp2610_24_pwr           |     1
Namespace
We choose to put all data in the namespace nav.stats.
Resulting config
[netbox_types]
path=nav.stats.devices.{}.{}
query=select vendorid, typename, count(*)
    from netbox join type using(typeid)
    group by typename, vendorid;
Thus the path for the values above will be:
nav.stats.devices.brocade.4/24_san_switch
nav.stats.devices.hp.hp2610_24
nav.stats.devices.hp.hp2610_24_pwr
(The script will do some modifications to the path to make sure Graphite can handle them.)
Result
The script (the one that is started as a cron-job when you write nav start
navstats) will make sure to run the SQL and send the output to Graphite.
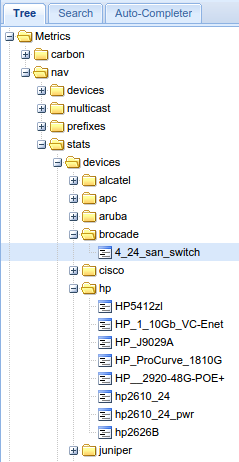
The result will be browsable in Graphite like shown below. You can use Graphite’s powerful web-api to access the data in the format you wish.