Debugging “gaps in graphs” syndrome
This document discusses various causes of missing Graphite data, AKA gappy graphs AKA holy graphs (or even completely blank graphs). You should verify each issue in the order they are listed.
Problems at the Graphite end of things
Whisper files have the wrong storage schema
If you forgot to copy NAV’s suggested rules for carbon-cache’s
storage-schemas.conf configuration file, you will have problems. Same
goes if a NAV upgrade included new rules you forgot to add.
The Whisper round robin database format expects data points to come in at the
same rate as specified in its first retention archive (the highest resolution
archive). The typical default values from storage-schemas.conf will
create Whisper files with their highest resolution archive set to 1 minute
intervals. Traffic data from NAV is collected in 5 minute intervals, which
means only every fifth data point would be populated in this scenario. That’s
not nearly often enough to draw a continuous line between data points.
The whisper-info (or whisper-info.py) can be used to
inspect individual .wsp files to see what resolution their first retention
archive is configured with (this is the secondsPerPoint value of archive
number 0). If this isn’t 300 seconds (5 minutes) for any
.wsp file located under the ports/ directory of a device, then you
know these have been created with the wrong schema.
There are two ways to resolve this. Both begin with adopting the proper storage schema rules from NAV’s suggested config. Following that, you can either:
Delete all the existing
.wspfiles that have the wrong schema. You will lose data.Use the whisper-resize (or
whisper-resize.py) program to resize individual.wspfiles, by specifying the correct schema (as per. NAV’s suggested schema rules).
UDP packets are being dropped
Because NAV sends data to Carbon using UDP, there is no guaranteed data reception. This could be solved by using TCP, but with a considerable performance penalty. As data collection in NAV is very bursty, it has occurred that the kernel’s UDP receive buffer has overflowed, causing the kernel to drop packets. This leads to gaps in the graphs.
Verify packet drops
On Linux, to verify that packets are being dropped, you can look in the
/proc/net/udp file and find the line with the local port the Carbon
daemon is listening to (default port 2003, or 07D3 in hex). The number
of packets dropped since the daemon started is shown in the last column. To
output only this number, use:
$ awk '$2~/07D3/{print $NF}' /proc/net/udp
4031
If this number keeps increasing, you are affected by the packet dropping issue.
Increasing the UDP receive buffer
If packets are being dropped, you can try to increase the kernel’s network receive buffer to avoid this. On Linux this can be done with the following commands:
sysctl net.core.rmem_max                  # See current setting
sysctl -w net.core.rmem_max=16777216      # Set max buffer to 16MB
sysctl -w net.core.rmem_default=16777216  # Set default buffer to 16MB
Experiment with different values until the packet dropping stops. You need to
restart the carbon daemon (carbon-cache or carbon-relay, depending on
your setup) to make the changes take effect.
Carbon’s cache is saturated
If the carbon-cache daemon (or daemons, if you have configured multiple) is unable to write data to your storage medium at a fast enough rate, its internal cache will be saturated, and it will start to drop incoming metrics. This will typically happen if the volume and rate of incoming metrics is larger than your I/O subsystem can support writing.
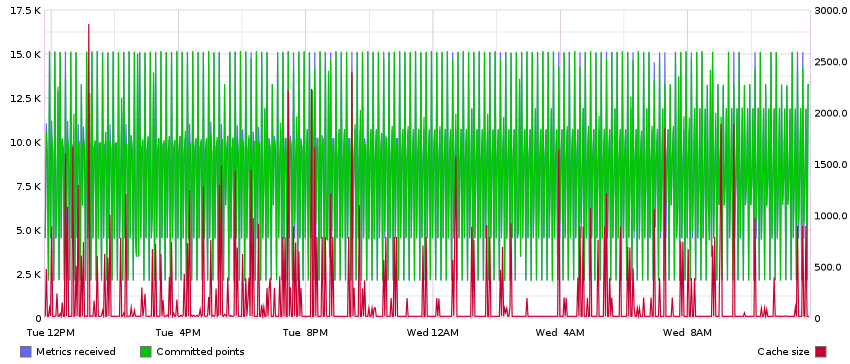
Use this NAV/Graphite URL to render a graph that can give some insight into what’s going on inside your carbon-cache:
/graphite/render/?width=852&height=364&from=-1day&target=alias%28sumSeries%28group%28carbon.agents.%2A.metricsReceived%29%29%2C%22Metrics+received%22%29&target=alias%28sumSeries%28group%28carbon.agents.%2A.committedPoints%29%29%2C%22Committed+points%22%29&target=alias%28secondYAxis%28sumSeries%28group%28carbon.agents.%2A.cache.size%29%29%29%2C%22Cache+size%22%29
This graph shows the relationship between incoming data points, and datapoints
committed to disk, while superimposing the size of the internal cache on top.
You should be able to quickly identify any capacity issues here: The rate if
incoming data points is continuously higher than the rate of committed points,
and the cache size is ever-increasing (until it at some points hits the max
cache size, configured in carbon.conf).
A healthy graph may look something like this (where the rate of incoming and committed points are roughly equal, and increases in cache size are only temporary):

You could add this graph to your NAV dashboard to monitor it continuously.
The only way around this is to scale up your Graphite infrastructure. You can add faster drives (solid state drives aren’t a bad idea), or set up a cluster of multiple Graphite servers. Please consult Graphite’s own documentation (or Google) on how to accomplish this.
As an alternative to this, you could consider whether you need to collect
traffic statics from every access port in your network. If you change the
category of an access switch from SW to EDGE in SeedDB, NAV will
effectively stop collecting traffic counters from its interfaces.